Stock Valuation Flow Chart
Posted on 02. Feb, 2011 by TheFreeInvestor in Investing Philosophy, Valuation
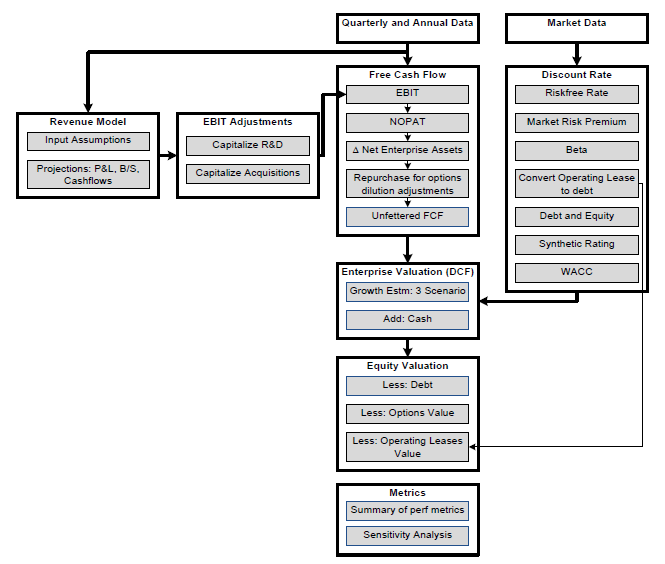
Even with all its shortcomings, discounted cashflow (DCF) valuation is one of the most widely used/abused stock valuation approaches. However, the plain vanilla DCF model needs a number of adjustments to be practically useful as a valuation tool. I captured the end to end process in this flow chart –
(Note: Click on the image for a larger view of the picture.)
1. Quarterly (10Q) and Annual (10K) Filings
I typically start reading last four quarters 10Qs and at least the last 10K. All the 10Ks and 10Qs are easily accessible from SEC website. The annual filings provide a good overview of the business drivers and segments etc. For financial modeling, I copy the last 10 annual and 6 quarterly data from Advfn website. Data on this website is organized in a standard number of rows of data which makes it easy to plug into pre-built models. So far I haven’t found any better source of free financial data in a detailed yet standardized format.
2. Revenue Model and Projections
I build a basic revenue model for the firm using the knowledge of business drivers gained from reading the annual and quarterly filings and listening to conference calls (though I rarely get time to listen to old conference calls). Using this revenue model, I project the P&L, balance sheet and cashflows for few years.
3. Adjusted EBIT and Free Cash Flow
One of the key ingredients of discounted cashflow analysis is the Free Cash Flow to the Firm (FCFF). In order to arrive at FCFF number, I start with reported EBIT and adjust for R&D capitalization and acquisition capitalization, where applicable. Using this adjusted EBIT number, I arrive at unfettered Free Cash Flow to the firm (FCFF) by calculating Net Operating Profit After Tax (NOPAT) and adjusting for change in enterprise assets and repurchase of stocks to compensate for options (especially in high tech firms).
4. Discount Rate / Cost of Capital
The other key ingredient of discounted cashflow analysis is the discount rate or cost of capital. I modify the standard formula to include the impact of converting operating lease to deemed debt and a synthetic rating of the debt using interest coverage ratio as explained by Prof.Damodaran in the models on his website. I admit that most of the times I use approximations rather than calculating bottom up beta.
5. Enterprise Valuation
I use the unfettered FCF, three growth scenarios (optimistic, pessimistic and realistic) and cost of capital to arrive at the value of the operating business. Adding the cash on the balance sheet to this number gives the enterprise value.
6. Equity Valuation
Backing out the outstanding debt, capitalized operating lease and value of outstanding options, gives the value to equity holders. Typically, I use 33% weight to each of the three scenarios to arrive at a final number.
Once the model is setup, updating it once a quarter takes minimal time. Of course, from company to company there are some additional variations. But, I think, the flow chart covers most of the critical aspects of the discounted cash flow process. One of the key criticism of DCF is that the valuation varies a lot depending on what discount rate you use. However, if you follow a logically consistent approach to calculating the discount rate, it is as good as it gets.


